A loudspeaker's frequency response is a key factor in determining its sound quality and accuracy. This response measures how well a loudspeaker reproduces different frequencies, from deep bass to high treble. If certain frequencies are too loud or too quiet compared to the original input signal, the loudspeaker may color the sound in a way that alters the listening experience. A well-balanced loudspeaker will reproduce sound accurately without introducing unintended tonal coloration.
Assessing a Loudspeaker’s Frequency Response
Frequency response refers to the range of frequencies a loudspeaker can reproduce and how accurately it does so. Measured in hertz (Hz), it represents how many sound wave cycles occur per second. For instance, deep bass vibrations occur around 50 Hz, while sharp treble tones reach 15,000 Hz (15 kHz). A good loudspeaker maintains a consistent and balanced output across its frequency range for accurate sound reproduction.
Most human ears perceive frequencies between 20 Hz and 20,000 Hz (20 kHz), though this varies by age and hearing ability. Some high-end loudspeakers extend beyond this range to enhance bass depth or treble clarity. While frequencies beyond human perception may not be directly heard, they can contribute to overtones and harmonics that shape the overall listening experience.
A loudspeaker's frequency response is typically described as a range (e.g., 50 Hz–20 kHz) with a variation in decibels (dB). The variation indicates how evenly the loudspeaker produces sound across frequencies. For example, a rating of 50 Hz–20 kHz ±3 dB means the loudspeaker's output does not fluctuate more than 3 dB from the target level within that range, ensuring a balanced performance.
Different loudspeakers have varying frequency responses based on their purpose. Subwoofers specialize in low frequencies (below 200 Hz), tweeters focus on high frequencies (above 2 kHz), and full-range loudspeakers attempt to cover a broad spectrum but may lack precision in the lowest and highest ranges.
An ideal loudspeaker would have a perfectly flat response—reproducing all frequencies equally—but in reality, no loudspeaker achieves this completely. Some are intentionally designed with frequency boosts or dips to enhance specific audio characteristics, such as making vocals warmer or improving speech clarity in communication systems.
How Frequency Response Is Measured
To accurately measure a loudspeaker's frequency response, professionals use anechoic chambers, high-quality microphones, and specialized software. These tools help eliminate outside noise and room reflections, ensuring that only the loudspeaker's true response is recorded. Slight variations in testing conditions can impact results, so consistency and proper calibration are essential.
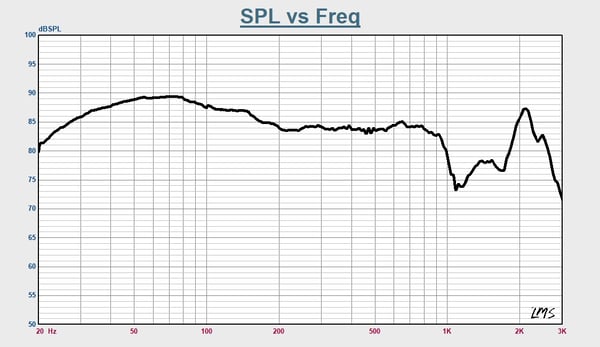
A frequency response graph visually represents this data, with frequency (Hz) on the x-axis and sound pressure level (dB SPL) on the y-axis. Ideally, a neutral loudspeaker would produce a flat line on this graph, meaning it plays all frequencies at the same volume. However, in reality, every loudspeaker exhibits some variation due to design, materials, and intended use.
Frequency Response Across Different Loudspeaker Types
Subwoofers
Subwoofers focus on low frequencies, typically below 200 Hz. Their response graph shows a strong presence in the lower range, tapering off as frequencies rise. These loudspeakers are critical for applications requiring deep bass, such as home theaters and concert sound systems.
Full-Range Drivers
Full-range drivers aim to cover the entire frequency spectrum, though they often struggle with extreme highs and lows. They are commonly used in consumer audio systems and portable loudspeakers, where a single driver must handle multiple frequencies.
Tweeters
Tweeters reproduce high frequencies, generally above 2 kHz. Their response curve typically shows a boost in the upper frequency range, ensuring clarity for instruments like cymbals and high-pitched vocals.
.jpg?width=600&height=351&name=TWEETER%20(1).jpg)
Guitar Loudspeakers
Unlike standard full-range loudspeakers, guitar loudspeakers are intentionally designed with a unique response curve. They emphasize midrange frequencies (2.5 kHz–4 kHz) while rolling off higher frequencies. This helps shape the distinct tonal character that musicians seek.

Specialized Loudspeakers
Some loudspeakers are built for specific applications, such as drive-thru intercoms and alarm systems. For example, a loudspeaker designed for speech clarity may focus on the 300 Hz–3 kHz range, as this is the most important frequency band for intelligibility. Alarm loudspeakers, on the other hand, often have a narrow, peaked response to make alerts easily noticeable.
Optimizing Loudspeaker Selection With Frequency Response Insights
Understanding frequency response is essential when selecting the right loudspeaker for a particular application. Whether for professional audio, home entertainment, or specialized communication systems, analyzing frequency response ensures that a loudspeaker performs optimally for its intended use. By examining frequency response graphs and considering the demands of the application, users can make informed choices to achieve the best possible sound quality.
Partnering With Experts for High-Performance Loudspeaker Solutions
Achieving the best possible audio outcomes requires collaboration with a trusted partner who understands the nuances of loudspeaker design. With more than 75 years of experience, MISCO has earned a reputation for designing and manufacturing high-performance loudspeaker systems.
Whether developing a custom audio solution for a specialized project or optimizing an existing design, our commitment to excellence remains unwavering. Every product undergoes rigorous testing to meet stringent quality standards. By leveraging advanced technologies such as laser scanning and comprehensive end-of-line tests, we ensure that your loudspeakers perform flawlessly in demanding applications.
If you're looking for a partner to help develop superior loudspeaker solutions, contact MISCO today. Our team is ready to collaborate and deliver the tailored results you need.